
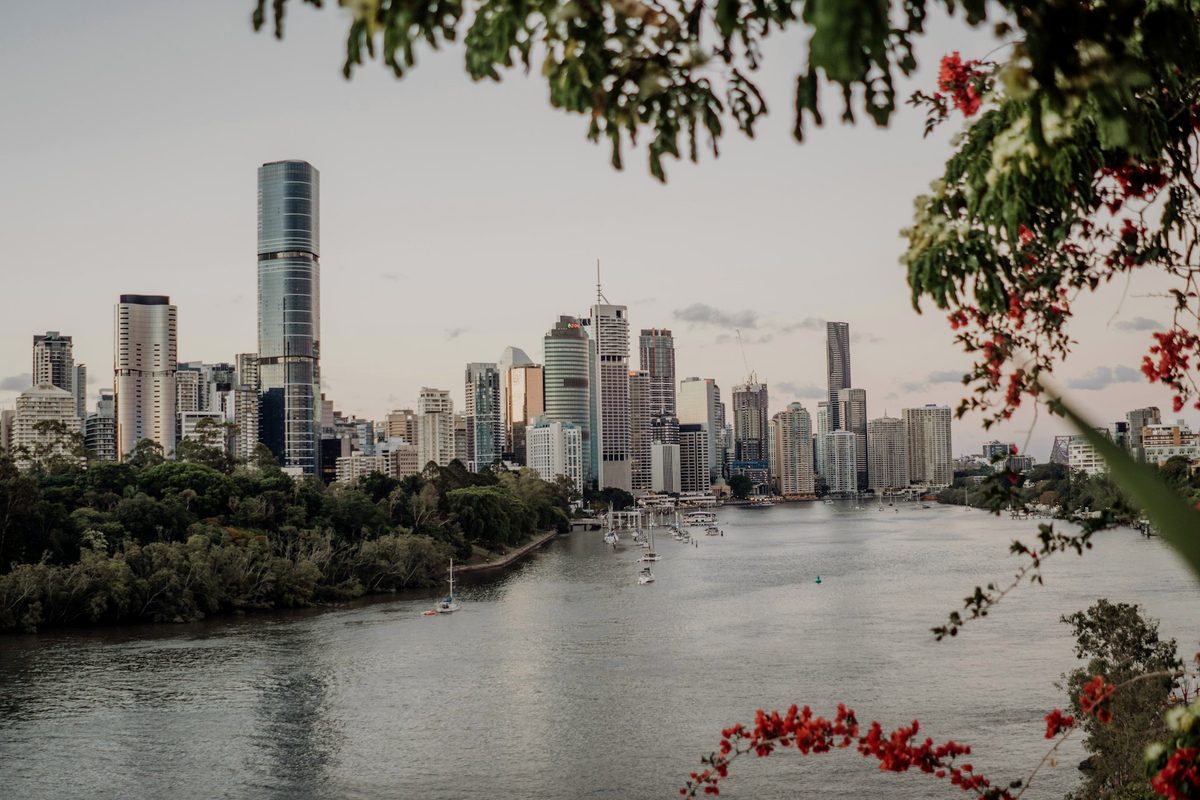
Melbourne or Sydney? It is the question that dominates every Australian property investment conversation, and it has done for decades. Both cities have delivered exceptional long-term returns, both attract significant population growth, and both offer deep, liquid markets across residential, commercial, and industrial sectors.
The honest answer is that neither city is universally "better" for investment. The right choice depends on your strategy, your budget, your risk tolerance, and the asset class you are targeting. This analysis sets out the key data points and considerations to help you make that decision with clarity.
This is general information only, not financial advice. Property investment carries risk, and past performance is not a reliable indicator of future results. Always seek independent professional advice before making investment decisions.
1 The Two-City Question
Australia's property market is often discussed as a single entity, but Sydney and Melbourne operate as distinct markets with different price cycles, different supply dynamics, and different demand drivers. They have historically moved in loose correlation but with notable divergences, particularly in periods of rapid rate movement or policy change.
Most investors who are building a portfolio across Australian property will eventually hold assets in both cities. The question is not "which city forever" but rather "which city first, given my current strategy and capital position." That framing produces far more useful answers than the binary debate that dominates most commentary.
2 Price Comparison: The Entry Point Gap
The most immediate difference between the two markets is price. Sydney remains the most expensive capital city market in Australia by a significant margin.
According to CoreLogic data from late 2025, Sydney's median house price sits at approximately $1.4 million, while Melbourne's median house price is around $920,000. That represents a premium of roughly 52% for a Sydney house over a Melbourne equivalent.
The gap narrows somewhat for units but remains substantial. Domain data suggests Sydney's median unit price is approximately $800,000, compared with Melbourne at around $560,000, still a 43% premium for Sydney.
| Metric | Sydney | Melbourne |
|---|---|---|
| Median house price | ~$1.4M | ~$920K |
| Median unit price | ~$800K | ~$560K |
| Entry-level house (outer ring) | ~$850K–$1M | ~$550K–$700K |
| Entry-level unit | ~$550K–$650K | ~$380K–$480K |
For investors, this price gap has practical implications. A 20% deposit on a median Sydney house requires approximately $280,000 in capital, versus $184,000 for Melbourne. That difference alone can determine which market is accessible, particularly for first-time investors or those building a portfolio with limited equity.
3 Rental Yields: Melbourne's Advantage
Melbourne has historically offered higher gross rental yields than Sydney across most residential asset classes. This is the natural consequence of lower entry prices relative to achievable rents, a dynamic that benefits cash-flow-focused investors.
Based on publicly available data from CoreLogic and SQM Research through late 2025 and into early 2026, the approximate gross yield ranges are:
| Asset Class | Sydney Gross Yield | Melbourne Gross Yield |
|---|---|---|
| Houses | 2.5%–3.5% | 3.5%–4.5% |
| Units | 3.5%–4.5% | 4.5%–5.5% |
These are broad ranges, and individual suburbs can sit well outside them. Melbourne's inner-city apartment market, for example, has seen yield compression in some pockets due to elevated supply. Conversely, well-located Sydney units in undersupplied corridors can exceed the upper range.
The yield differential matters most for investors who need the property to be cash-flow neutral or positive from day one. At current interest rate levels, a Melbourne investment property is considerably more likely to achieve that than a comparable Sydney asset, simply because the rent-to-price ratio is more favourable.
4 Capital Growth: Sydney's Historical Edge
Over extended timeframes, 20 years or more, Sydney has generally outperformed Melbourne on capital growth. CoreLogic's long-run data shows Sydney dwelling values have grown at a compound annual rate of approximately 6.5%–7% over the past two decades, compared with roughly 5.5%–6% for Melbourne.
However, that outperformance comes with greater volatility. Sydney's market tends to rise faster in upswings and correct more sharply in downturns. The 2017–2019 correction saw Sydney prices fall approximately 15% peak to trough, while Melbourne's correction was closer to 11%. Similarly, Sydney led the post-COVID recovery with sharper gains before plateauing earlier.
Melbourne's growth profile has been more measured, fewer dramatic peaks and shallower troughs. For investors with a lower risk tolerance or a shorter intended hold period, that consistency can be more valuable than the higher headline growth rate.
Capital growth is never guaranteed. Both cities have experienced extended periods of flat or negative growth. Any investment strategy that depends on continuous price appreciation is inherently fragile.
5 Growth Drivers and Infrastructure
Sydney
Sydney's growth story is fundamentally a supply constraint narrative. The city's geography, hemmed in by the Blue Mountains to the west, national parks to the north, and water to the east and south, limits the supply of developable land in established areas. This structural constraint underpins long-term price growth.
Key infrastructure projects shaping Sydney's investment landscape include:
- Sydney Metro West. Connecting the CBD to Parramatta via a new underground rail line, with stations at key employment and residential nodes. This project is reshaping property values along the entire corridor.
- Western Sydney International Airport. The new airport at Badgerys Creek, due to open in the coming years, is catalysing an entirely new economic precinct in Western Sydney, with significant implications for residential and industrial property demand in the surrounding area.
- Finance and technology sectors. Sydney remains Australia's financial capital and its largest technology employment hub. These sectors drive high-income demand for both residential and commercial property.
- International migration. Sydney consistently attracts the largest share of Australia's overseas migration, creating sustained demand for housing, particularly rental accommodation.
Melbourne
Melbourne's growth story centres on population. It has been Australia's fastest-growing capital city for several years, driven by both international migration and interstate movement. The city's relative affordability compared with Sydney continues to attract residents and businesses alike.
Key infrastructure and demand drivers include:
- Suburban Rail Loop. A transformative project that will create a new orbital rail network connecting Melbourne's middle suburbs. The first stage (Cheltenham to Box Hill) is underway and is expected to significantly improve accessibility and property values in suburbs along the route.
- Metro Tunnel. Now operational, the Metro Tunnel has expanded the capacity of Melbourne's rail network and improved connectivity to key employment precincts, particularly in the inner south-east and west.
- Population growth. Melbourne is projected to overtake Sydney as Australia's largest city within the next decade, according to ABS population projections. This sustained growth underpins long-term demand across all property classes.
- Interstate migration. Melbourne's relative affordability continues to attract buyers and renters from Sydney, with many remote workers choosing Melbourne's lifestyle at a lower cost of living.
- Education and health sectors. Melbourne's concentration of universities and major hospital precincts creates consistent demand for housing and commercial space in surrounding suburbs.
6 Commercial and Industrial Markets
For investors considering commercial or industrial property, the Melbourne-Sydney comparison takes on different dimensions. The industrial and logistics sector, in particular, has been one of the strongest-performing asset classes nationally over the past five years.
Industrial and Logistics
Melbourne's western suburbs have emerged as one of Australia's most significant logistics corridors. Suburbs such as Truganina, Derrimut, and Laverton North have attracted major distribution centres and e-commerce fulfilment facilities, driven by proximity to major road networks and the Port of Melbourne.
Sydney's western logistics corridor, centred on Wetherill Park, Eastern Creek, and Prestons, offers similar fundamentals but at significantly higher price points. Industrial land values in Sydney's western corridor have, according to various industry reports, grown considerably faster than Melbourne's equivalent areas, pushing entry costs substantially higher.
| Metric | Sydney West | Melbourne West |
|---|---|---|
| Typical industrial yield | 4.5%–5.5% | 5.0%–6.5% |
| Entry cost (small warehouse) | $2.5M–$5M+ | $1.5M–$3.5M |
| Vacancy rate (prime) | Very low | Low, but rising slightly |
Melbourne's industrial market offers a more accessible entry point with higher yields, making it attractive for investors seeking income-producing commercial assets without the capital requirements of the Sydney market. However, Sydney's tighter supply constraints and proximity to a larger consumer market provide a stronger argument for long-term capital appreciation.
Office and Retail
Both cities' CBD office markets have undergone structural change since 2020, with higher vacancy rates and shifting tenant preferences toward flexible, high-quality space. Suburban office markets have shown more resilience, particularly in well-connected nodes like Parramatta (Sydney) and Box Hill and South Melbourne (Melbourne).
Retail property performance is highly location-specific in both cities and requires detailed local analysis that goes beyond a city-level comparison.
7 Risks to Consider
Every market carries risks, and an honest assessment requires acknowledging them clearly.
Sydney Risks
- Affordability ceiling. Sydney's prices are at a level where further growth depends on continued wage growth, population demand, and access to finance. Any tightening in lending standards or sustained interest rate increases puts disproportionate pressure on the most expensive market.
- Interest rate sensitivity. Higher-priced assets carry larger loans, making Sydney properties more sensitive to rate movements on an absolute dollar basis. A one percentage point rate increase costs materially more on a $1.2 million mortgage than a $750,000 one.
- Rental affordability pressure. There is growing political pressure around rental affordability in Sydney, which may result in policy interventions that could affect investor returns, whether through tenancy law changes, tax settings, or planning regulations.
Melbourne Risks
- Inner-city apartment oversupply. Melbourne experienced a significant apartment construction boom through the 2010s, and some inner-city precincts, particularly Southbank, Docklands, and parts of the CBD, continue to carry elevated vacancy and subdued capital growth as a result. Investors need to be highly selective about location and building quality in the unit market.
- Land tax changes. The Victorian government has introduced a number of land tax changes in recent years, including the COVID debt levy and adjustments to thresholds and rates. These additional holding costs reduce net yields and have been cited by some investors as a reason to favour other states.
- Economic diversification. While Melbourne's economy is well-diversified, it is more exposed to sectors like education (international students) and manufacturing than Sydney's finance-heavy economy. Changes in immigration policy or global education demand can affect Melbourne's population growth trajectory.
8 Which City Suits Your Strategy?
Rather than declaring a winner, it is more useful to map each city's strengths against common investment strategies.
If your priority is rental yield and cash flow, Melbourne is generally the stronger choice. Lower entry prices and higher gross yields make it easier to achieve a cash-flow-neutral or positive position, particularly for houses in the middle and outer ring suburbs. Melbourne units in well-located, low-supply areas can also deliver attractive yields.
If your priority is long-term capital growth, Sydney has the historical edge, supported by its structural supply constraints and concentration of high-income employment. However, you need to be comfortable with the higher entry cost and the likelihood of sharper cyclical corrections along the way.
If you are building a diversified portfolio, consider holding assets in both markets. The two cities do not always move in lockstep, which provides a degree of geographic diversification. A common approach is to start in the more affordable market to build equity, then use that equity to enter the higher-priced market.
If you are targeting commercial or industrial assets, Melbourne's western logistics corridor offers a more accessible entry point with solid yields. Sydney's equivalent corridor is more expensive but benefits from tighter supply. For smaller investors entering the commercial space for the first time, Melbourne's price point is often more realistic.
If you are investing through an SMSF, the borrowing constraints of limited recourse borrowing arrangements (LRBAs) make the deposit and cash-flow requirements critical. Melbourne's lower price points and higher yields often make SMSF property investment more feasible from a compliance and cash-flow perspective.
The best investment is not always in the market with the highest past returns. It is the one that aligns with your financial position, your risk tolerance, and your clearly defined investment objectives.
Final Thoughts
Melbourne and Sydney will both continue to be strong property markets over the long term. Australia's population growth, urbanisation trends, and structural housing undersupply support that view. The question is not whether to invest in either city, it is which city best serves your particular goals at this particular point in your investment journey.
The data in this article draws on publicly available information from CoreLogic, Domain, SQM Research, and the Australian Bureau of Statistics. Market conditions change, and the figures cited here reflect a point in time. Always verify current data before making investment decisions, and seek advice from qualified professionals, including financial advisers, tax advisers, and property specialists, before committing capital.
Disclaimer: This article is general information only and does not constitute financial, tax, or investment advice. Bold Property Group is a buyer's advocacy firm, not a licensed financial adviser. The information presented reflects publicly available market data and general market commentary. Individual circumstances vary, and you should obtain independent professional advice tailored to your situation before making any investment decision.